Data maturity scan – how mature are we and what do we need to work on?
Cmotions helps organizations develop in working with data and all that it entails. We focus on the sustainable monetization of the value of data. In practice, it turns out to be challenging to actually make data work for an organization’s goals. And this requires more than including a paragraph on data in the multi-year plan.
“We are very data-driven because as a director, I mentioned the importance of data in the strategy presentation, right?”
To determine where you stand as an organization and what organizational aspects you specifically need to work on, the data scan was developed three years ago. This scan is based on the ‘data-driven working’ growth model and the various organizational aspects and ambition levels used in it (see box below). By now, so many organizations have used this scan that interesting insights have emerged. This article lists five interesting learnings.
GROWTH MODEL – Working data-driven
Working data-driven requires attention to all organizational aspects. From Strategy and control, people, organization, processes and resources (data & infrastructure). For growth, we define four levels of development where we left out level 0 (data as a hobby of a few in the organization). Each level translates to a score in the scan.
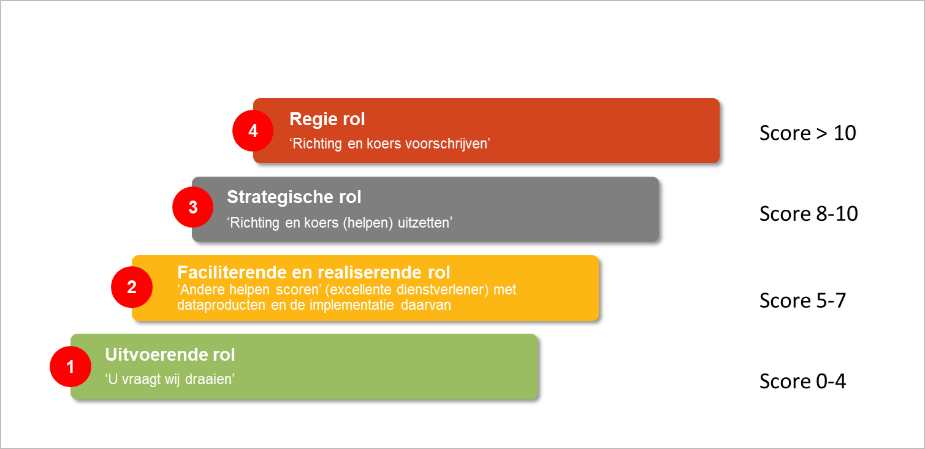
If we combine the organizational aspects and growth levels, our maturity model emerges, providing guidance for positioning and development to the desired level. This is because the model provides direction for action per organizational aspect for balanced growth. You will only be truly successful in this growth if you develop these aspects in balance.
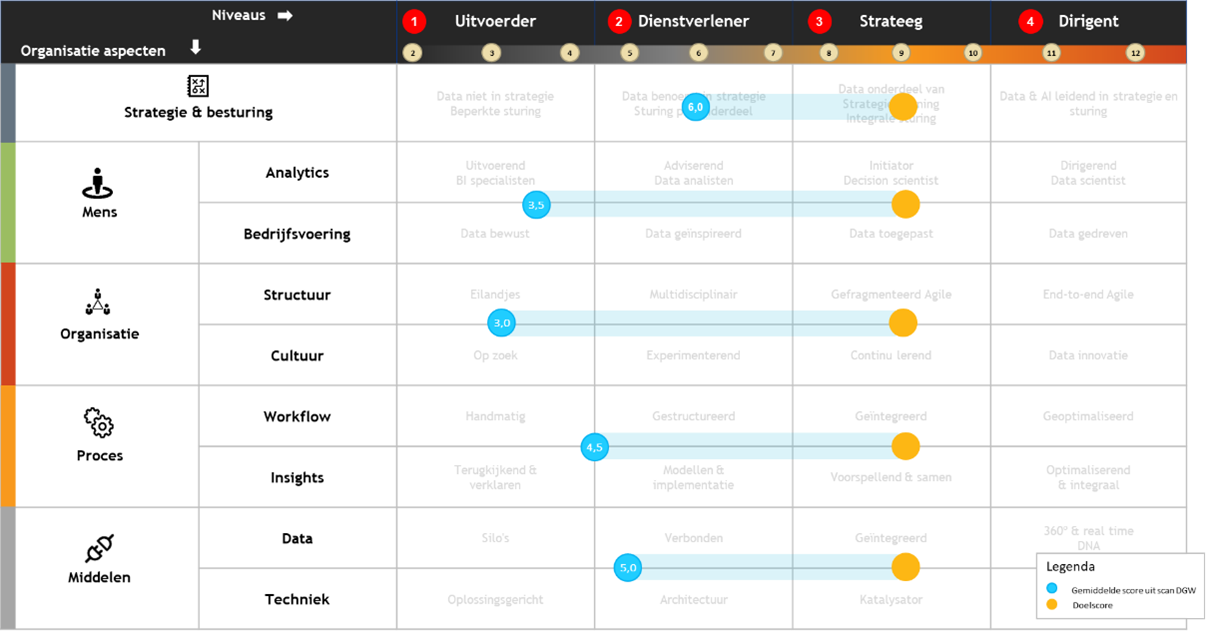
The results of the data-driven work scan indicate how mature you are as an organization and can be plotted on the sub-areas. They thus indicate the gaps in the level of ambition.
Insight 1 – The value of data is recognized, but putting it into practice is difficult
Overall, we see scores around 4-5 (Maximum score: 12) per organizational aspect. That is, most organizations estimate that they are in the transition from “a counter for data questions” to “data as a facilitor”: supporting the objectives of different organizational units. Interestingly, there are no organizations in our survey yet that estimate that data already plays a fully strategic or even higher role.
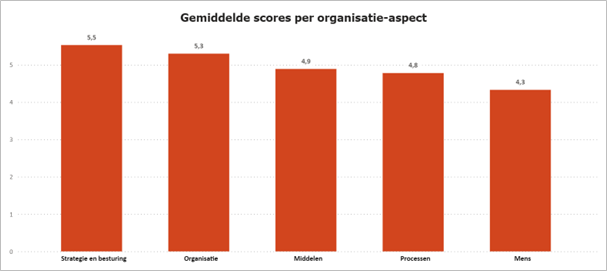
On average, the organizational aspects “Strategy and control” and “Organization” score highest among the participants of our scan. The extent to which data has a role in strategy and the investment of those aspects in the organization seem to be further along than, for example, the development of data competencies and behavioral change among people in the organization. In fact, the latter component scores the lowest.
If we zoom in a bit more on sub-questions from the scan, we see the trend that data & analytics is valued at an abstract level and is seen as strategically relevant. People are often satisfied with the presence of data. But, strikingly, the more concrete and tangible the question becomes, the lower the scores are. Concrete sub-themes that score low include:
- Fixed practices – ‘Processes’
- The role and quality of analysts’ work – ‘People’
- Data architecture – ‘Resources’
Thus, most organizations are generally aware of the value of data and satisfied with the raw data at their disposal, but see growth opportunities in the practical application and concretization of their data & analytics activities.
Insight 2 – Smaller organizations lack strategic framework – large organizations struggle with execution
If we compare smaller organizations (0-50 employees) with larger organizations (100 employees or more), we see that the smaller organizations estimate that they are still really at the beginning. Remarkably, they score particularly low on “strategy and governance. We see the awareness that scoring with data starts with clear principles and choices to use data purposefully – and that this is what they lack.
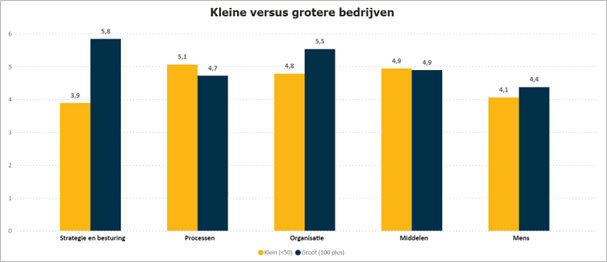
In larger organizations, on the other hand, we see that they score higher on policy and organizational structure but struggle relatively more with the more practical aspects of actually implementing it. Not surprising when you consider that some of our clients are trying to get a few thousand people to make the transition to a learning organization. Based on data and facts for better decisions. And with a legacy of complex systems and data flows.
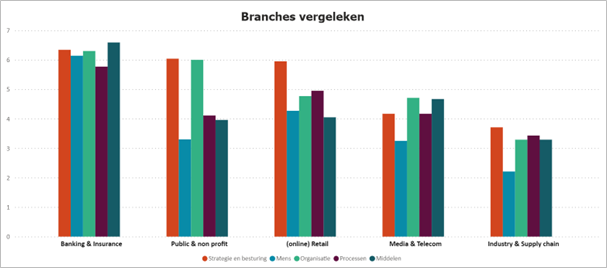
Insight 3 – Naturally data-intensive industries are ahead and more balanced
What we see when we compare industries (overview is not exhaustive) is that the traditionally data-intensive industries score higher on average. And that the various sub-aspects of data-driven work score more in balance. In particular, we see financial parties (banks and insurers) and subsequent (online) retail parties and public service providers scoring higher and more balanced. Industrial and logistics parties score lowest in our research and rate themselves lower, especially on the use of data for innovation.
The extent to which the organizational aspects are in balance says something about the extent to which you manage to grow in cohesion. If you score high on only a few aspects, you will not succeed in taking the desired steps as an organization. You may have qualitative data and insights, but not yet the awareness and will to actually act upon them. Or you have a strong strategy but fail to translate it into processes and resources.
Insight 4 – Decision makers rate maturity higher than those who process the data
Not everyone has the same perception of maturity or degree of success in data-driven work.
We distinguish in the scan different roles when it comes to working with data. From decision makers (board/ senior management) and users to the “producers” of data and insight.
A striking picture here is that particularly within much larger organizations, the decision-makers assess the maturity in sub-areas more positively than the people who actually process the data. And in particular, often in the areas for which they are responsible.
Exaggeratedly, you could say that if a “director” has included the importance of data in the strategy or has made budget available for investment in a data warehouse, the subsequent perception is that “they” are then very advanced in that area. The people who have to work with it in practice really do see it differently.
Feedback of these kinds of differences within one’s own organization leads to interesting conversations. It brings images together and makes concrete where the potential and complexity of working with data really lies. Comparing scores per role is therefore particularly interesting within the organization itself rather than as an average across all organizations.
Insight 5 – Growth takes time
If we look at the development of estimated maturity over three years, we see no upward trend. This may be due to the diversity of organizations but is also a lesson in itself. Many of the organizations we come into contact with are ambitious in their timelines in the movement to more data-driven work. And while this is often possible on the more “hard aspects” (infrastructure, organizational structure), getting people, competencies, behavior and culture moving proves to be the most lengthy and underestimated hurdle. Growing in balance on the more “soft” aspects takes time.
Monitoring the development of scores on data-driven working is particularly interesting again for organizations themselves. To periodically test for the development in maturity, the growth on partial aspects and the sharpening of aspects that are lagging behind. We help organizations with these types of assessments to focus on progress and development according to a clear approach.
In summary: the power of reflection, collaboration and translation of lessons to one’s own organization
The self-assessments built up over three years are a good basis. We do not yet have a fully comprehensive survey in the market but it already provides a variety of interesting insights. And with the growth of respondents, this will only increase over time. We will therefore follow up on this periodically.
The potential of the insights from the scans is mainly the reflection of images in one’s own organization, inspiration from other organizations and the practical translation into action: what are we going to work on now in order to continue to grow?
The great thing is that the scan almost always shows that different people within the same organization judge aspects very differently. We know that powerful steps and acceleration are possible if they find each other in it, understand it and take the lessons with them in the translation to a good action plan.
Get started yourself and learn from similar organizations
Do the insights from this article trigger you? Then do the scan at Cmotions | Scan for insight into data-driven. By completing the scan you will also contribute to further developing insights in the field of data-driven work. If you want to get started right away, please contact us. We would love to get in touch to see how your organization can take the next step and how you are doing compared to similar organizations!